How We Deliver 99.9%+ Uptime with You.com Inference Router


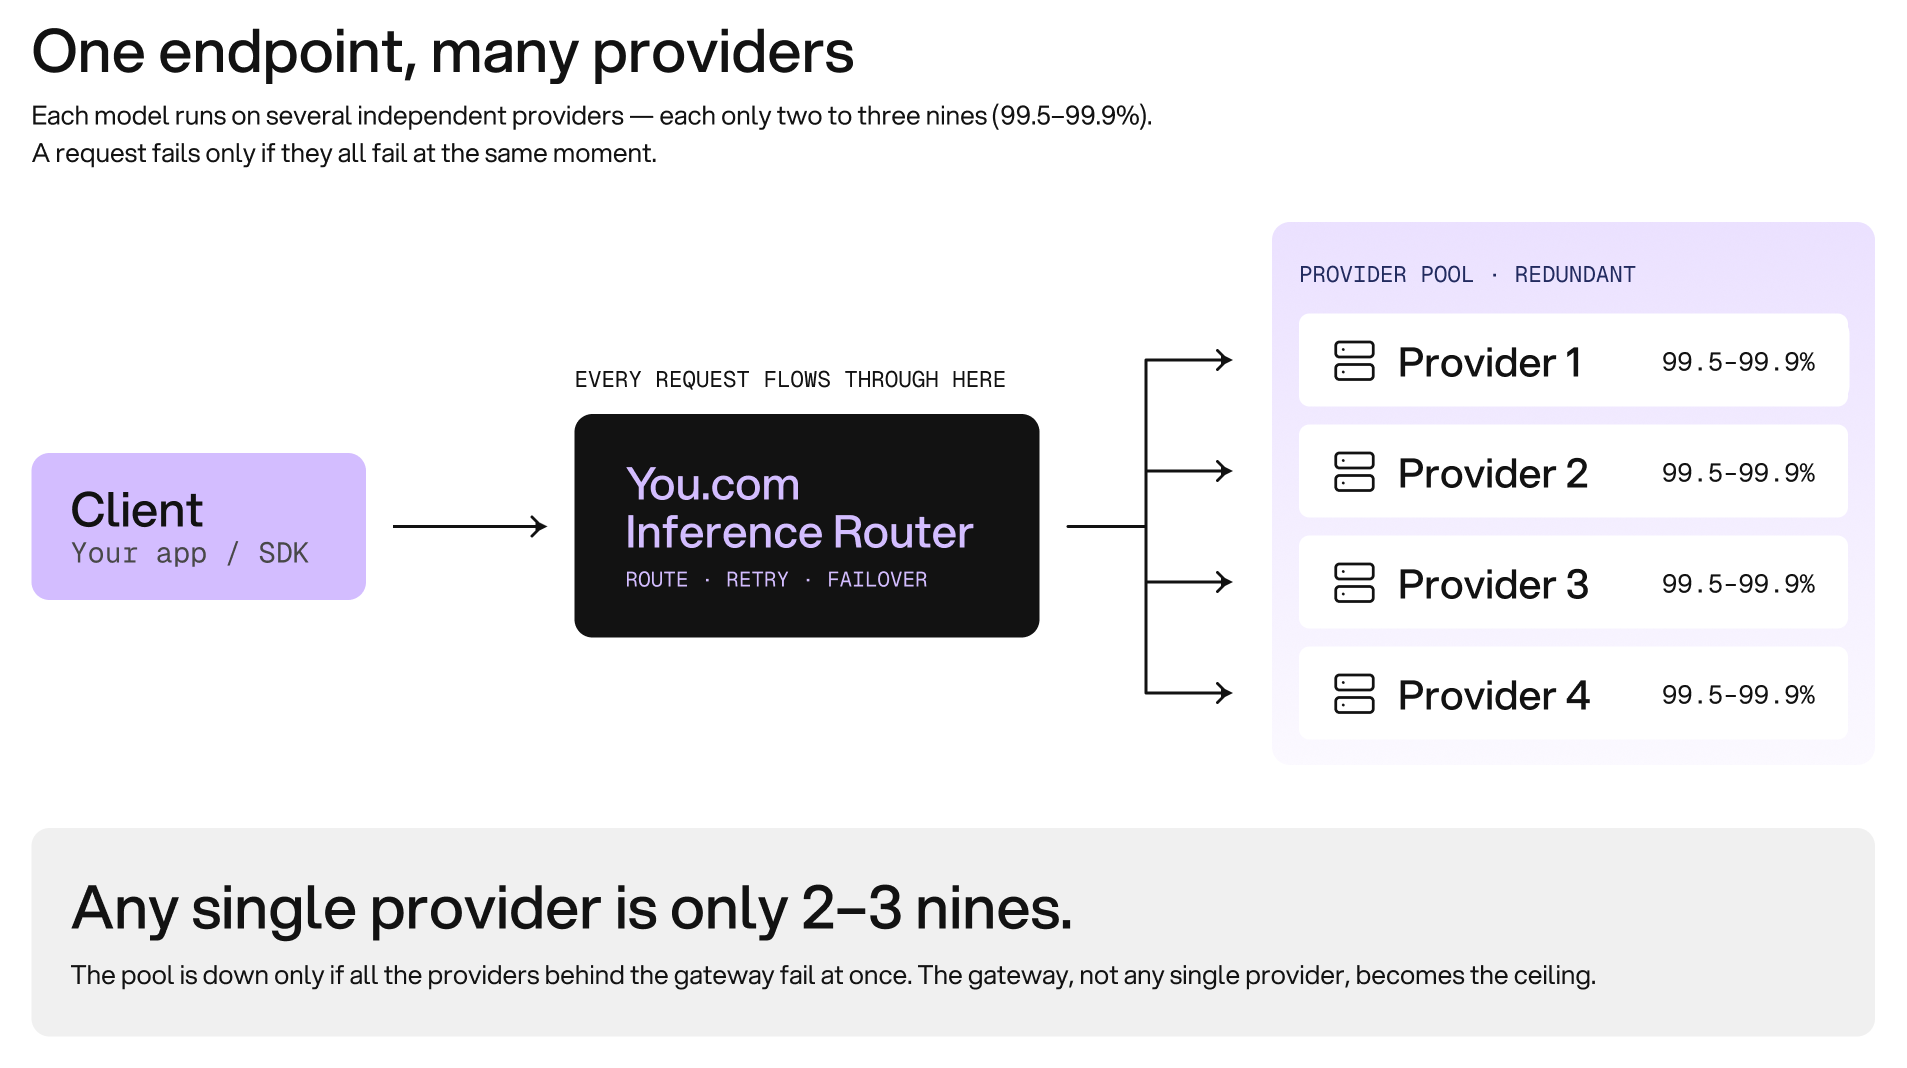
Every inference provider we build on publishes an uptime SLA of 99.9% or less. We commit to 99.9%+ for the router as a whole. The reasonable question is: how can the composite be more reliable than any of its parts? The answer is an old idea from reliability engineering which is redundancy, applied carefully, plus a lot of unglamorous engineering to make that redundancy real. Here's the model we actually use and how we build to it.
The shape of it: one router, many providers
The design has two parts that behave very differently:
- The router control plane: the one layer every request flows through (auth, routing, retries, failover). It is one logical layer, so if it is down, everything is down. It sets the ceiling.
- The provider pool: behind the router, each model is served by several independent providers including our own. The router tries one, and on failure tries the next, so the pool is down only if every provider fails at the same moment.
Put together, the overall system is down only when the router control plane is down, or every provider for that model is down at once:
In plain terms, overall_system is the availability a customer actually experiences, and router_control_plane is our own router's availability: one shared layer, so it caps everything. The last part is the redundancy: the odds that every provider is down at the same instant, which is tiny, and that is what lifts us off any single provider's number.
A single 99.9% provider may be down up to 43.8 min a month. Put four of them behind the router and, if their failures were independent, the pool is down only when all four fail at the same moment: theoretically around twelve nines. That exact number is a fantasy (next section), but the direction is real: the provider layer stops being the thing that limits us. The router control plane becomes the ceiling.
The honest version: shared failures and the router cap
That tiny-odds story assumes two things that aren't true: that provider failures are independent, and that failover always works. Providers share failure modes (the same cloud region, the same model release, the same upstream lab), so some outages hit several providers at once. If a fraction of each provider's downtime is common to all of them (a shared-failure rate), the real picture is roughly:
Running our own numbers for four providers at 99.9%:
Two lessons fall out, and they drive where we spend:
- Shared failures, not provider count, set the real ceiling. Going from four providers to eight barely moves the number if the shared-failure rate stays the same. Lowering that rate through diversity of provider, region, and model release moves it a lot.
- The router control plane is the cap. Every request flows through it, so our own router, auth, network and compute infrastructure set the ceiling. Redundant providers behind a fragile router buy nothing. Most of our reliability budget goes here, not into adding a fifth provider.
Turning the math into uptime
Redundancy on a diagram is not uptime. These are the mechanisms that make that redundancy real:
- Health- and latency-aware routing. We route on live signal and steer away from a provider that is slow or erroring before it fully fails: brownouts, not just hard-downs.
- Fast failure detection. Retries with backoff and jitter, and a per-error-class retry policy, so a transient blip is retried rather than surfaced.
- In-request failover. On a failed attempt we immediately retry on an alternate healthy provider within the same request, so the client sees a success, not a 5xx. Clients need to handle partial stream failures.
- Circuit breakers. A provider that errors past a threshold is tripped open and drained, with a cooldown and half-open probing before it is trusted again. This is the Release It! pattern, applied per provider.
- Operator drain / kill-switch. We can remove a provider instantly and deliberately (a bad release, an active incident) without a code deploy.
- Fail open. The routing layer makes its decision inside a tiny time budget and never returns a routing-layer error of its own.
- N−1 capacity. Redundancy is only real if the survivors can absorb the load. We provision roughly 33% headroom per model (enough to lose one of four), so failover doesn't just convert outages into 429s.
- Highly reliable control plane. Since the router is the ceiling, we built it for resiliency: stateless, multi-replica, multi-region, deep health checks, gradual deploys. Session affinity keeps a conversation on one provider to preserve prompt caching, without blocking failover when that provider goes bad.
Measuring it honestly
An SLA you can't measure is marketing. We define the SLI per request (a success is a completed response), compute the SLO over a rolling window, and run an error budget against it (at 99.9%, about 43.8 minutes a month). We hold a tighter internal SLO than we publish, and spend the gap on deploys and experiments without putting the customer number at risk.
One subtlety bites in practice: the 99.9% inputs to the model only hold if each provider measures availability per request, on our traffic, per model. A fleet-wide, minute-based provider SLA can hide exactly the failures that hit us, so we write per-request, per-model availability into provider contracts. Availability is also per model: a model served by two providers gets two-provider math, so coverage is a routing and onboarding decision, never a blanket claim.
What we commit, and why
We publish at least a 99.9% monthly uptime SLA. What the redundancy actually buys our customers is simpler to state: one provider having a bad moment is a non-event. The request that would have failed is retried on another provider, in the same call, and the user never notices. That is the whole point of putting many 99.9%s behind one endpoint.
LI Test
LI Test
Share Article:
Related resources.

5 Best Free Web Search MCP Servers in 2026: Keyless Options and Free Tiers
October 11, 2026
Blog

5 Parallel AI Alternatives in 2026: What to Compare Before You Commit
October 9, 2026
Blog

SerpApi vs Google Custom Search in 2026: Data, Cost, and Limits
October 6, 2026
Blog

Exa vs Perplexity API for AI Agents: Retrieval Modes, Answers, and Pricing
October 6, 2026
Blog

Tavily vs Perplexity API for AI Agents: Results, Answers, and Credit Models
October 6, 2026
Blog