Introducing the You.com Finance Research API: Agentic Research, No Infra Required

LI Test
URL CopiedLI Test
TLDR: The You.com Finance Research API is purpose-built for developers who need accurate, current, and deeply sourced intelligence in their financial workflows. Built on the You.com Research API, and augmented with licensed structured data from S&P Global and others, the Finance Research API runs multi-step agentic research and returns a JSON object with a markdown response, inline [[n]] citation tags, and a sources array mapping every citation to a URL.
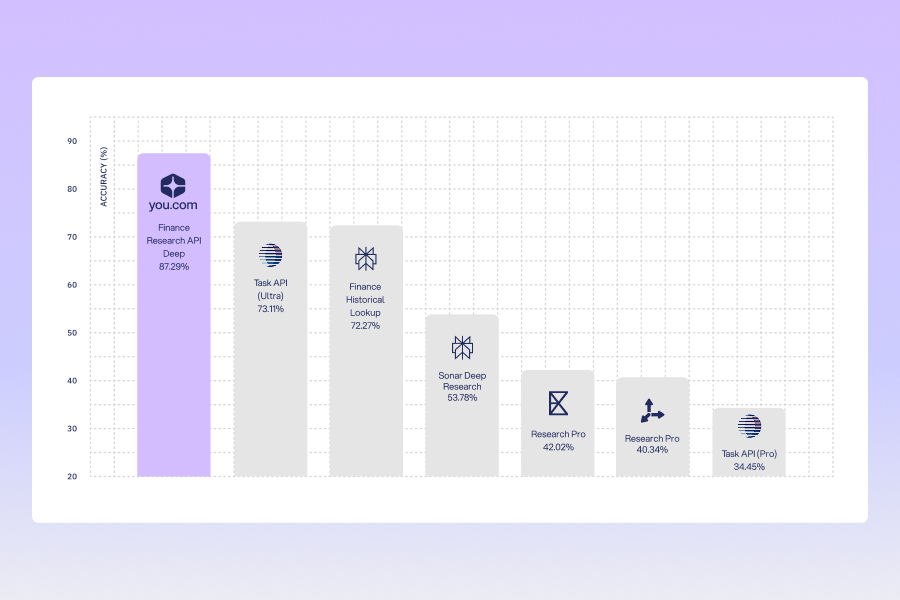
On FinSearchComp's (arXiv 2509.13160) historical lookup benchmark (T2), the Finance Research API scores 87.29% at $110 per 1,000 queries (Deep tier), more than 14 points ahead of the next best system at any price point.
It's available today, self-serve, at https://you.com/docs/finance-research/overview.
In finance, the problem with AI isn't that it gets things wrong. The problem is that it gets things wrong confidently. Financial data changes constantly and lives in dozens of fragmented sources, each with different methodologies, reporting cadences, and definitions. General-purpose AI can approximate financial research. It can't reliably resolve the conflicts that make the answer defensible. Those confidently wrong decisions lead to poor financial results and product abandonment.
A concrete example of what this means in practice: ask for Apple's Q3 2025 revenue and one source reports Apple's fiscal Q3 (ending June), another reports calendar Q3 (ending September), and a third converts the USD figure to EUR for a European filing. These are three different numbers for what looks like the same question. Most systems return one of them without telling you which, or return all three without resolving the conflict. The Finance Research API matches the exact period and definition you asked for, discards the others, and cites the primary source.
What We Built
The Finance Research API extends AI search with two finance-specific capabilities: a unified data layer combining live web intelligence with licensed structured financial data, and evidence reconciliation across conflicting sources. Both are built on the You.com Research API, which handles the underlying multi-step agentic search, source reconciliation, and structured output.
Licensed Structured Financial Data
The Finance Research API draws on institutional-grade data from licensed providers and public institutional sources, the same data financial professionals already rely on rather than scraped approximations.
The coverage spans four categories:
- Public-Company Filings. Revenue by segment, contractual obligations, footnote values, debt tables, and fiscal-year disclosures from S&P Global, SEC/EDGAR, and investor-relations sources.
- Macroeconomic Data. Inflation, GDP, unemployment, trade balances, fiscal indicators, and country-level comparisons from FRED, BLS, BEA, Eurostat, World Bank, IMF, OECD, and EIA, with source-vintage-specific values so you get the exact revision you ask for.
- Market and Benchmark Data. Commodity contracts, exchange data, benchmark rates, and date-specific market values from QUODD, NASDAQ, and institutional feeds.
- Derived Calculations. Ratios, growth rates, percentage shares, unit conversions, and cross-source comparisons where every input is retrieved, aligned, and cited before the calculation runs.
Finance-Specific Evidence Arbitration
Researching financial data means working through conflicts: mismatched fiscal years, adjacent quarters, different reporting currencies, source-vintage discrepancies. The Finance Research API reconciles these by matching the exact period, unit, source, and definition before returning a figure.
The API also researches beyond the licensed data, pulling from regulatory filings, central bank statements, earnings coverage, and sector analysis to build a complete picture, and every figure and fact in the research output is cited back to its source.
Example: Request and Response
Request
A single POST with a financial question and a research effort level:
Shell
curl -X POST https://api.you.com/v1/finance_research \
     -H "X-API-Key: $YDC_API_KEY" \
     -H "Content-Type: application/json" \
     -d '{
  "input": "In 2024, what was Apple\'s inventory turnover rate as a multiple of
Tesla\'s inventory turnover rate? Use each company\'s fiscal-year 2024 cost of revenue
and average inventory from their annual reports, show the formula, and round the multiple
to two decimal places.",
  "research_effort": "deep"
}'
Response
The response includes the answer with inline citation tags mapped to the source list:
JSON
{
  "output": {
    "content": "**Answer: Apple's fiscal-year 2024 inventory turnover was 4.94× Tesla's.**[[1]][[2]][[3]][[4]]\n\nFormula: inventory turnover = cost of revenue / average inventory\n\n- Apple turnover = 210,352 / ((7,286 + 6,331) / 2) = 30.8955× [[1]][[2]]\n- Tesla turnover = 80,240 / ((12,017 + 13,626) / 2) = 6.2582× [[3]][[4]]\n- Multiple = 30.8955 / 6.2582 = **4.94×** [[1]][[2]][[3]][[4]]",
    "content_type": "text",
    "sources": [
      {
        "url": "https://www.sec.gov/Archives/edgar/data/320193/000032019324000123/R3.htm",
        "title": "CONSOLIDATED STATEMENTS OF OPERATIONS"
      },
      {
        "url": "https://www.sec.gov/Archives/edgar/data/320193/000032019324000123/R5.htm",
        "title": "CONSOLIDATED BALANCE SHEETS"
      },
      {
        "url": "https://www.sec.gov/Archives/edgar/data/1318605/000162828025003063/R5.htm",
        "title": "Consolidated Statements of Operations"
      },
      {
        "url": "https://www.sec.gov/Archives/edgar/data/1318605/000162828025003063/R62.htm",
        "title": "Inventory - Schedule of Inventory (Detail)"
      }
    ]
  }
}
The Benchmark: FinSearchComp
FinSearchComp (arXiv 2509.13160) includes 635 questions built by 70+ finance experts, covering the kinds of queries that financial professionals actually run: company filings, macroeconomic data, market and benchmark lookups, derived calculations, and cross-source investigation.
The benchmark is organized into three sub-tasks, each testing a different capability:
- T1: Time-Sensitive Data Fetching. Retrieving real-time, frequently updated data (latest close prices, exchange rates, commodity prices). Answers are verified against live market APIs.
- T2: Simple Historical Lookup. Retrieving specific historical facts from financial records (total assets as of a given date, quarterly revenue figures, historical index values). Fixed answers with rounding tolerance.
- T3: Complex Historical Investigation. This is the hardest tier. It requires multi-step reasoning, cross-source aggregation, and calculation across historical data points rather than direct lookup.
We're reporting T2 and T3 results for this release, on the English-only queries. T1 tests real-time data that changes by the second—any published score would be outdated within hours and it is difficult for third parties to reproduce.
T2: Simple Historical Lookup
| System | Accuracy | Latency (P50) |
|---|---|---|
| You.com Finance Research API (Deep) | 87.29% | 124.0s |
| Parallel Task API (Ultra) | 73.11% | 861.3s |
| Perplexity Finance Historical Lookup | 72.27% | 32.2s |
| Perplexity Sonar Deep Research | 53.78% | 92.6s |
| Exa Research Pro | 42.02% | 366.8s |
| Tavily Research Pro | 40.34% | 104.5s |
| Parallel Task API (Pro) | 34.45% | 317s |
On a benchmark built by 70+ finance experts covering the kind of multi-source, cross-period queries that break general-purpose systems, 87.29% represents the highest accuracy recorded to date. The next closest system on accuracy runs at 861 seconds P50. The fastest system in the table scores 72.27%.
T3: Complex Historical Investigation
| System | Accuracy | Latency (P50) |
|---|---|---|
| You.com Finance Research API (Exhaustive) | 60.71% | 232.1s |
| You.com Finance Research API (Deep) | 58.33% | 359.6s |
| Perplexity Finance Multi-Step Research | 55.95% | 31.2s |
| Parallel Task API (Ultra) | 46.43% | 996.5s |
| Tavily Research Pro | 36.90% | 283.3s |
| Parallel Task API (Pro) | 36.90% | 339.0s |
| Exa Research Pro | 26.19% | 268.1s |
| Perplexity Sonar Deep Research | 21.43% | 137.2s |
Don't just take our word for it, test it yourself.
What It Looks Like in Practice
Consider a macro research workflow: analyze 2025 EU GDP across all member states, identify countries with anomalous growth trajectories, attribute the divergence by industry, and surface the macroeconomic context behind it.
That query requires pulling structured GDP data from multiple national statistics offices and Eurostat, cross-referencing sector-level indicators, reconciling different reporting cadences and methodologies across 27 countries, and tying the numbers to context like central bank commentary, fiscal policy shifts, and trade dynamics.
The Finance Research API runs the full workflow and returns normalized, cited, structured output.
A reference implementation built on LangChain's Deep Agents and LangSmith’s Fleet infrastructure demonstrates this workflow end-to-end, including parallel execution across all EU member states and human-in-the-loop review at the anomaly detection stage as part of the LangChain demo’s workflow. View full example output including country-by-country breakdown, industry attribution, macroeconomic root causes, and 21 cited sources in our GitHub repo.
The same API also powers a range of other workflows including earnings research agents, pre-deal diligence tools, competitive intelligence workflows, and financial Q&A copilots.
Pricing
The Finance Research API uses a per-request pricing model with two tiers based on research depth. All prices are per 1,000 requests.
| Tier | Price per 1,000 requests | Best for |
|---|---|---|
| Deep | $110 | Difficult filings, conflicting sources, exact macro/statistical values |
| Exhaustive | $500 | High-value multi-source investigations where accuracy justifies latency |
The research_effort parameter controls which tier a request uses. Start with deep for most workflows and move to exhaustive when the query involves cross-source reconciliation.
What the API Does Not Do
The Finance Research API is optimized for correctness over speed. A few boundaries worth knowing before you build.
- Not general-purpose research. The Finance Research API is built for finance. For non-financial research, use the Research API directly.
- Not sub-second market data. The API pulls near-real-time prices and rates, but it is not a tick-level data feed. If you need sub-second execution data or streaming quotes, use a dedicated market data provider.
- Not investment advice. The API returns cited research artifacts. It does not make portfolio recommendations, generate trading signals, or offer opinions on whether to buy or sell.
- Coverage is strongest for US public companies and major global indices. International filings, emerging market equities, and non-English-language sources have more limited coverage today. This is expanding.
- Macro data follows official publication schedules. BLS, BEA, Eurostat, and similar agencies publish on fixed cadences. The API cannot surface economic data before the source agency releases it.
- Latency scales with research depth. Deep and exhaustive queries, particularly T3-class multi-step investigations, can take minutes. The tradeoff is accuracy: the API runs parallel research branches and cross-source verification rather than returning the first plausible answer.
Get Started
The Finance Research API is available today on self-serve with a $100 of free credit for new users. Get your API key at you.com/docs and make your first call:
curl -X POST https://api.you.com/v1/finance_research \
     -H "X-API-Key: $YDC_API_KEY" \
     -H "Content-Type: application/json" \
     -d '{
  "input": "What was Apple revenue in Q3 fiscal 2025?",
  "research_effort": "deep"
}'
The response includes cited, source-attributed output. Full documentation, reference implementations, and integration guides are at you.com/docs/finance-research/overview.
It's also available as a first-class integration in LangChain via the langchain-youdotcom package or through the hosted MCP server at https://api.you.com/mcp.
Featured resources.
.webp)
Paying 10x More After Google’s num=100 Change? Migrate to You.com in Under 10 Minutes
September 18, 2025
Blog
September 2025 API Roundup: Introducing Express & Contents APIs
September 16, 2025
Blog
You.com vs. Microsoft Copilot: How They Compare for Enterprise Teams
September 10, 2025
Blog
All resources.
Browse our complete collection of tools, guides, and expert insights — helping your team turn AI into ROI.
.png)
When a Simple Search Isn't Enough: Building With the Research API
Tyler Eastman
,
Lead Android Developer
March 23, 2026
Blog

Welcoming Saahil Jain as Next You.com CTO
Richard Socher
,
You.com Co-Founder & CEO
March 17, 2026
Blog

10 Creative Ways to Use AI Web Search & Research in Your n8n Workflows
Tyler Eastman
,
Lead Android Developer
March 13, 2026
Blog
You.com Search APIs: More Value at a Lower Cost
You.com Team
March 11, 2026
Blog

Why Your AI Search Evaluation Is Probably Wrong (And How to Fix It)
Zairah Mustahsan
,
Staff Data Scientist
March 10, 2026
News & Press

AI for Efficiency: Where It Delivers Results and Where It Falls Short
You.com Team
March 10, 2026
Blog

Why AI with Real-Time Data Matters
You.com Team
March 5, 2026
Blog
.png)
Effective AI Skills Are Like Seeds
Edward Irby
,
Senior Software Engineer
March 2, 2026
Blog