What Is API Latency? How to Measure, Monitor, and Reduce It

LI Test
URL CopiedLI Test
TLDR: API latency is the time between sending a request and receiving the first byte of response. High latency causes user drop-off, timeout errors, and unpredictable costs at scale. Most slowdowns trace back to a handful of fixable causes.
API latency compounds fast. Every page load includes API calls to fetch data, authenticate users, or retrieve content. When those calls slow down, so does everything else. Portent's 2022 study of over 100 million page views found that sites loading in one second convert at 3x the rate of sites loading in five seconds. In microservices architectures, where applications are split into many small services that call each other, one request can trigger multiple downstream API calls. Each slow service multiplies the problem.
Understanding where latency hides and how to measure it makes the difference between debugging blind and fixing the actual bottleneck.
What Is API Latency?
Think of API latency as the stopwatch running from the moment your client sends a request until that first byte comes back. You'll also hear this called Time to First Byte (TTFB). In contrast, total response time includes the full payload transfer after that initial byte arrives.
Research on human perception shows that responses under 100ms feel instant, while anything between 100ms and one second feels responsive but noticeable. Once latency crosses the one second threshold, users perceive the system as slow.
If your checkout flow calls three services sequentially at 200ms each, users wait 600ms before they see confirmation. (Assuming nothing times out.)
How to Measure API Latency
Your dashboard says average latency is 200ms. Looks healthy. But if 95% of requests take 200ms and 5% take 10 seconds, that "average" of 690ms describes nobody's actual experience. Averages lie.
Instead, production systems track percentiles:
- P50 (median) shows typical user experience
- P95 reveals what the slowest 5% experience, often where problems hide
- P99 captures tail latency from edge-case bottlenecks
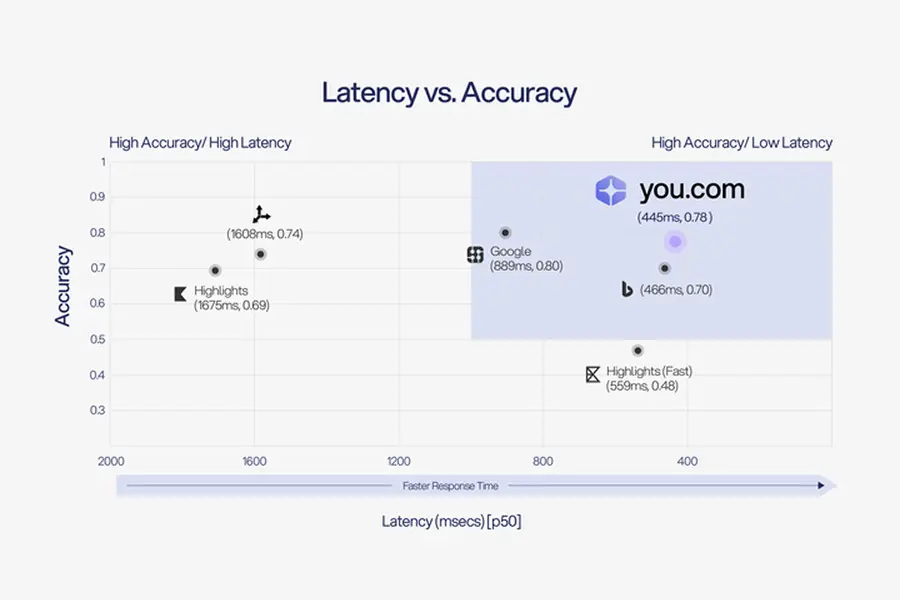
Different use cases demand different latency tolerances. For AI search APIs handling real-time queries, staying under 1 second keeps interactions feeling responsive. The You.com Search API delivers P50 latency of 445ms, well under that threshold. A batch processing API running overnight analysis can tolerate higher latency if throughput stays high.
Here's the tradeoff: lower latency doesn't come free. You either pay for more compute and closer edge locations, or you return less data and sacrifice response depth.
What Causes High API Latency?
Five bottlenecks cause most latency problems: network delays, server processing, payload size, third-party dependencies, and queuing. In practice, production environments rarely have just one culprit. Multiple factors compound each other, which is why diagnosing latency requires tracing requests end-to-end.
Network Delays
Physical distance between client and server creates irreducible delay. A user in Tokyo connecting to a server in Virginia pays that cost on every new connection. DNS resolution, TLS handshakes, and TCP connection setup all add overhead before the first real request even starts.
Server Processing
A database query that scans a million rows instead of hitting an index can add seconds to every request. Complex queries, unoptimized lookups, and CPU-intensive transformations are common culprits.
Serverless functions add another wrinkle. Cold starts happen when a function hasn't run recently and needs to initialize before handling a request. Python and Node.js functions typically add 200 to 400 milliseconds while Java and .NET can exceed one second.
Payload Size
Large payloads take longer to serialize, transmit, and parse. The problem compounds when APIs return entire objects by default, even when clients only need a few fields. A response carrying 50KB of JSON when 2KB would suffice wastes bandwidth and processing time on both ends.
Third-Party Dependencies
Let’s say your payment service calls Stripe, your AI feature calls OpenAI, and your search calls an external API. Each dependency adds latency outside your control, and when one slows down, your users feel it first. When evaluating external APIs, look for providers that publish P95 and P99 latency commitments, not just averages. A 99.9% uptime SLA gives you something to build around.
Queuing and Rate Limiting
Sometimes the bottleneck isn't processing at all. Even when individual requests complete quickly, other requests may block them in a queue. Queuing delays often exceed actual processing time. Under load, rate limiting adds artificial delays or outright rejections.
How to Reduce API Latency
Each bottleneck has proven fixes. The challenge is identifying which one to tackle first.
Network Optimization
If your users span multiple regions, start here. Edge caching and CDNs serve responses from servers closer to users, eliminating cross-continent round trips. Connection pooling reuses established connections instead of negotiating new ones for each request, which helps most when your application makes frequent calls to the same endpoints. HTTP/2 multiplexing goes further by sending multiple requests over a single connection, reducing the overhead that stacks up in chatty microservices architectures.
Server-Side Improvements
When traces show processing time dominating your latency budget, look at your code first. Optimizing queries and database indexes often yields the biggest gains because they address root cause rather than masking it with more hardware.
For serverless architectures, pre-warming keeps functions initialized so users don't pay cold start penalties. Horizontal scaling becomes necessary when single-instance optimization hits diminishing returns and you need to distribute load across multiple servers.
Payload Reduction
Large responses mean longer transfer times. Pagination helps when clients don't need entire datasets at once, breaking results into smaller chunks. Endpoint design matters just as much: APIs built with minimal token bloat return concise, relevant data rather than forcing you to parse oversized responses. Composable architectures take this further by letting you call specific building blocks instead of one monolithic endpoint that returns everything. Once you've trimmed what you're sending, compression squeezes the remaining payload by 70% or more before it hits the wire.
Dependency Management
External services are latency you can't control, but you can limit the damage. When you're calling multiple dependencies, async execution runs them in parallel so one slow service doesn't block the others. Caching makes sense for data that doesn't change frequently, cutting repeated calls to the same endpoints. For everything else, aggressive timeouts with fallback responses keep a single unresponsive dependency from stalling your entire application.
Queue Management
If latency spikes correlate with traffic spikes, queuing is likely the culprit. Autoscaling adds capacity before queues build up, but it takes time to spin up new instances. When scaling can't keep pace, load shedding deliberately drops low-priority requests to protect critical ones. Priority queues offer a middle ground, ensuring the system processes important requests first even when under pressure.
Putting It Together
These factors rarely appear in isolation. Consider a developer who notices P95 latency spiking from 800ms to three seconds during peak hours. Investigation reveals DNS lookup at 50ms, TLS handshake at 100ms, queue wait at 1.5 seconds during peaks, actual search at 400ms, and payload transfer at 200ms. The fix is not faster search but connection reuse and autoscaling to reduce queue time.
How to Monitor API Latency
Proactive monitoring catches latency problems before users complain or downstream systems timeout. The key is measuring from multiple vantage points and alerting on the right thresholds.
Key Metrics to Track
Start with latency percentiles (P50, P95, P99) because they expose outliers that aggregate metrics miss. Add error rates to see whether latency spikes correlate with failures, and track throughput to distinguish load-driven slowness from request-specific slowness. Saturation metrics like CPU, memory, and connection pool usage signal when you're nearing resource ceilings.
Monitoring Approaches
You need visibility from multiple angles.
- Client-side measurement captures round-trip time from the caller's perspective, including network latency the server cannot see.
- Server-side instrumentation tracks processing time at the API gateway and individual service layers, helping isolate whether your code or infrastructure causes the slowdown.
Synthetic monitoring fills the gaps. By sending scheduled requests from multiple geographic locations, you catch regional degradation and establish baseline performance during low-traffic periods when real user data is sparse.
Tools and Implementation
The right monitoring tool depends on your team's capacity and existing stack. Application Performance Monitoring (APM) platforms like Datadog, New Relic, and Dynatrace provide full-stack visibility with minimal setup, making them a good fit for teams that want fast time-to-value and can absorb the cost.
Open-source alternatives like Prometheus with Grafana for metrics and Jaeger for tracing require more maintenance but offer flexibility and lower ongoing costs for teams with ops capacity.
If you're already running on a major cloud provider, their native options (AWS CloudWatch, Google Cloud Monitoring, Azure Monitor) integrate tightly with your infrastructure and reduce vendor sprawl.
Set alerts on P95 and P99 latency with thresholds based on your service level objectives (SLOs). Include context in alerts like endpoint, traffic level, and correlated errors so responders can diagnose quickly.
Start Building with Low-Latency APIs
Diagnosing slow APIs comes down to measurement and isolation. Percentiles show you who's actually suffering, and request-level traces pinpoint where time gets lost. Armed with both, you can fix the real bottleneck instead of guessing.
When evaluating API providers, latency specs matter more than marketing claims. A provider's baseline latency becomes your floor, and their worst-case latency becomes your ceiling during traffic spikes.
The Search API from You.com delivers a composable architecture that lets developers optimize individual queries for speed or accuracy. For AI applications that need current web data without sacrificing response time, You.com provides infrastructure built for real-time search at scale.
Frequently Asked Questions
What's the difference between API latency and response rate?
Latency measures speed per request. Response rate (or throughput) measures how many requests your infrastructure completes per unit of time, typically requests per second. A system can be fast but fragile (low latency, low throughput) or resilient but slow (high throughput, high latency under load). When response rate stays high and latency stays flat, your API is healthy. When latency climbs alongside traffic, you're approaching capacity limits. Chat and autocomplete require low latency because users feel every millisecond; batch processing prioritizes completing volume over speed.
How does API latency differ between REST, GraphQL, and gRPC?
REST APIs make separate requests for each resource, which can multiply latency when fetching related data. GraphQL reduces round trips by fetching multiple resources in a single request, but query complexity can increase server processing time.
A protocol designed for fast service-to-service communication—gRPC—uses binary serialization and HTTP/2 multiplexing, which typically results in lower latency than JSON-based protocols for high-frequency internal calls. The right choice depends on your use case, not on which protocol is "fastest" in isolation.
What latency SLA should I request from third-party API providers?
Ask for P95 and P99 latency commitments, not just averages. A provider promising "200ms average latency" might have a P99 of 3 seconds, which means 1 in 100 of your users experiences significant delays. For real-time user-facing features, look for P95 under 500ms. For background processing, higher latency may be acceptable if the provider offers better throughput or lower cost. Get SLAs in writing and confirm what happens when providers miss them.
How does caching affect latency measurements?
Cache hits return responses significantly faster than origin requests, which skews latency metrics if you measure them together. Track cache hit rate separately and segment latency measurements into cached versus uncached requests. A high cache hit rate with fast cache responses can mask slow origin performance that users experience on cache misses. Monitor both the cache layer and origin latency independently.
How do I debug intermittent latency spikes that don't appear consistently?
Intermittent spikes often correlate with garbage collection pauses, connection pool exhaustion, cold starts, or downstream dependency slowdowns. Start by checking whether spikes correlate with traffic patterns, time of day, or specific endpoints. Distributed tracing helps identify which service in a request chain introduces the delay. Log slow requests with full context including timestamp, endpoint, and upstream dependencies to find patterns across incidents.
Should I optimize for average latency or tail latency first?
Optimize tail latency first. Improving P99 from 3 seconds to 500ms helps your slowest users immediately and often reveals systemic bottlenecks affecting everyone. Average latency improvements feel less dramatic because they're diluted across all requests. Once tail latency is under control, optimizing P50 improves typical user experience. The exception is high-volume pipelines where completing all requests matters more than any single request's speed.
Featured resources.
.webp)
Paying 10x More After Google’s num=100 Change? Migrate to You.com in Under 10 Minutes
September 18, 2025
Blog
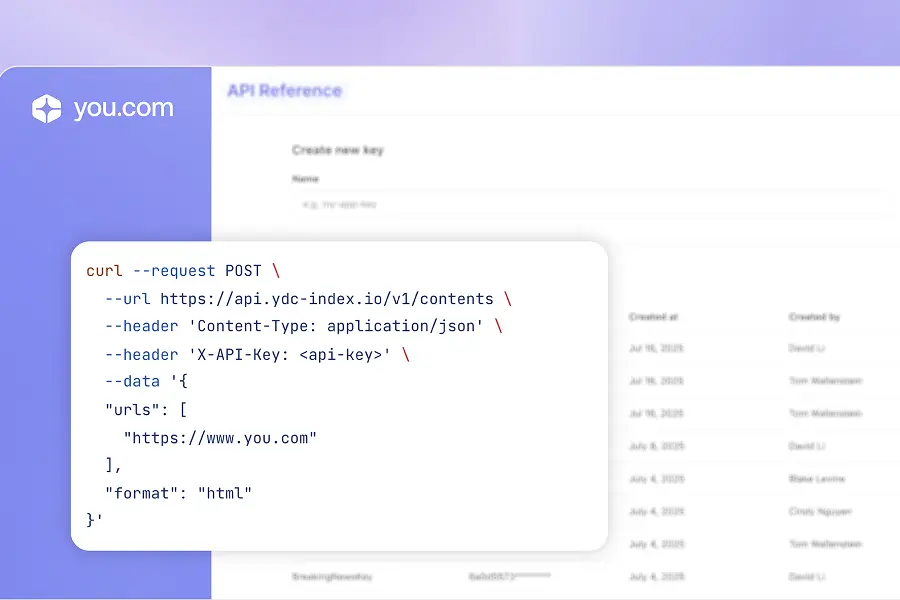
September 2025 API Roundup: Introducing Express & Contents APIs
September 16, 2025
Blog
You.com vs. Microsoft Copilot: How They Compare for Enterprise Teams
September 10, 2025
Blog
All resources.
Browse our complete collection of tools, guides, and expert insights — helping your team turn AI into ROI.
September 2025 API Roundup: Introducing Express & Contents APIs
You.com Team
September 16, 2025
Blog
You.com vs. Microsoft Copilot: How They Compare for Enterprise Teams
You.com Team
September 10, 2025
Blog
You.com vs OpenAI: Which Platform is the Best AI for Enterprise
You.com Team
September 10, 2025
Blog
You.com Powers OpenAI’s New GPT OSS Models: New Era of Open, Accurate AI
You.com Team
September 7, 2025
Blog

You.com Becomes a Unicorn, Shifts Away From Search Engine Plans
You.com Team
September 3, 2025
News & Press

You.com Raises $100M Series C at a $1.5 Billion Valuation to Build the Infrastructure for the Agentic Era
You.com Team
September 3, 2025
News & Press

6 Proven Templates for a Secure AI Rollout
You.com Team
September 1, 2025
Guides
Search API for the Agentic Era: Optimize Accuracy, Freshness, Latency & Cost
You.com Team
August 26, 2025
Blog